TLDR: you can apply functions on data to make it easier to handle, to see the code click here
Over the past 30 years, the amount of data that has been produced has grown exponentially. When there is a large set of multidimensional data, the chance that some data might overlap can occur. In this post, we will be talking about Dimensional Reduction and Feature Extraction. These are needed in Machine Learning/ Deep Learning to allow the Neural Networks an easier way to map the data.
Dimensional reduction is typically choosing a basis or mathematical representation within which you can describe most but not all of the variance within your data, thereby retaining the relevant information, while reducing the amount of information necessary to represent it. Feature Selection is hand-selecting features that are highly discriminating. This has a lot more to do with feature engineering than analysis and requires significantly more work on the part of the data scientist. It requires an understanding of what aspects of your dataset are important in whatever predictions you’re making, and which aren’t. Feature extraction usually involves generating new features which are composites of existing features
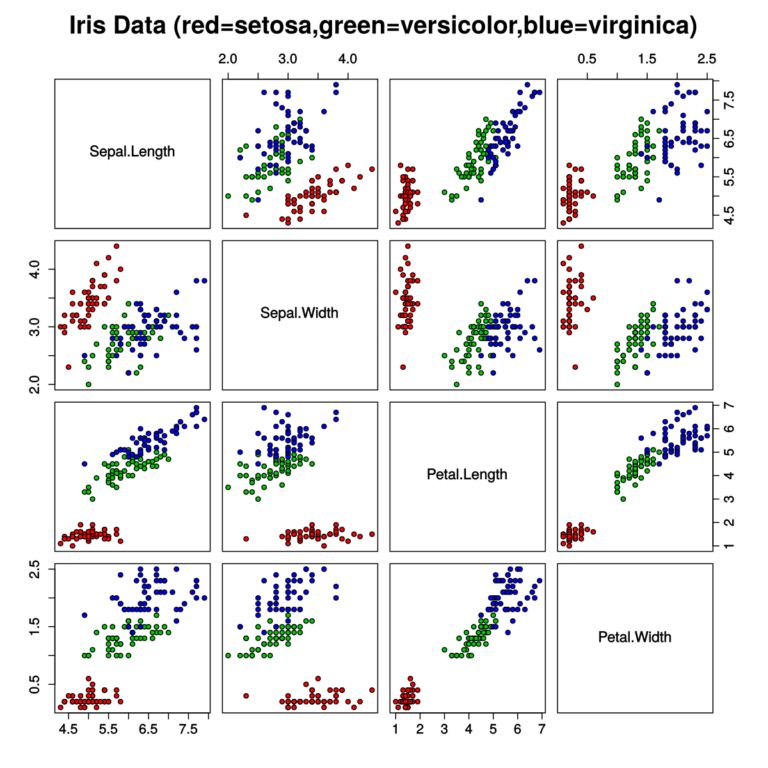
We will be looking at the iris dataset, which is relatively small but has four dimensions.If you where to take the raw data and try to parse it, it would be visualized as such: